Yield Curve Inversion Signals Recession Concerns
On March 15, 2019, a key economic indicator triggered alarm bells across global markets: the U.S. Treasury yield curve inverted. For many economists and investors, this is one of the most reliable warning signs of an impending recession.
While the term might sound technical, its implications are deeply real — and historic. Every U.S. recession in the past 50 years has been preceded by an inversion of the yield curve. So, what happened in March 2019, why is it important, and what should investors and policymakers make of it?
What Is the Yield Curve?
The yield curve is a graphical representation of the interest rates on U.S. government bonds (Treasuries) across different maturities — from short-term (like 3-month T-bills) to long-term (such as 10-year or 30-year bonds).
Under normal circumstances, the curve is upward sloping, meaning that longer-term bonds yield more than short-term ones. This makes intuitive sense: investors require higher compensation for locking in their money for longer periods.
However, when the curve inverts, short-term rates rise above long-term rates — a rare and often ominous occurrence.
What Happened in March 2019?
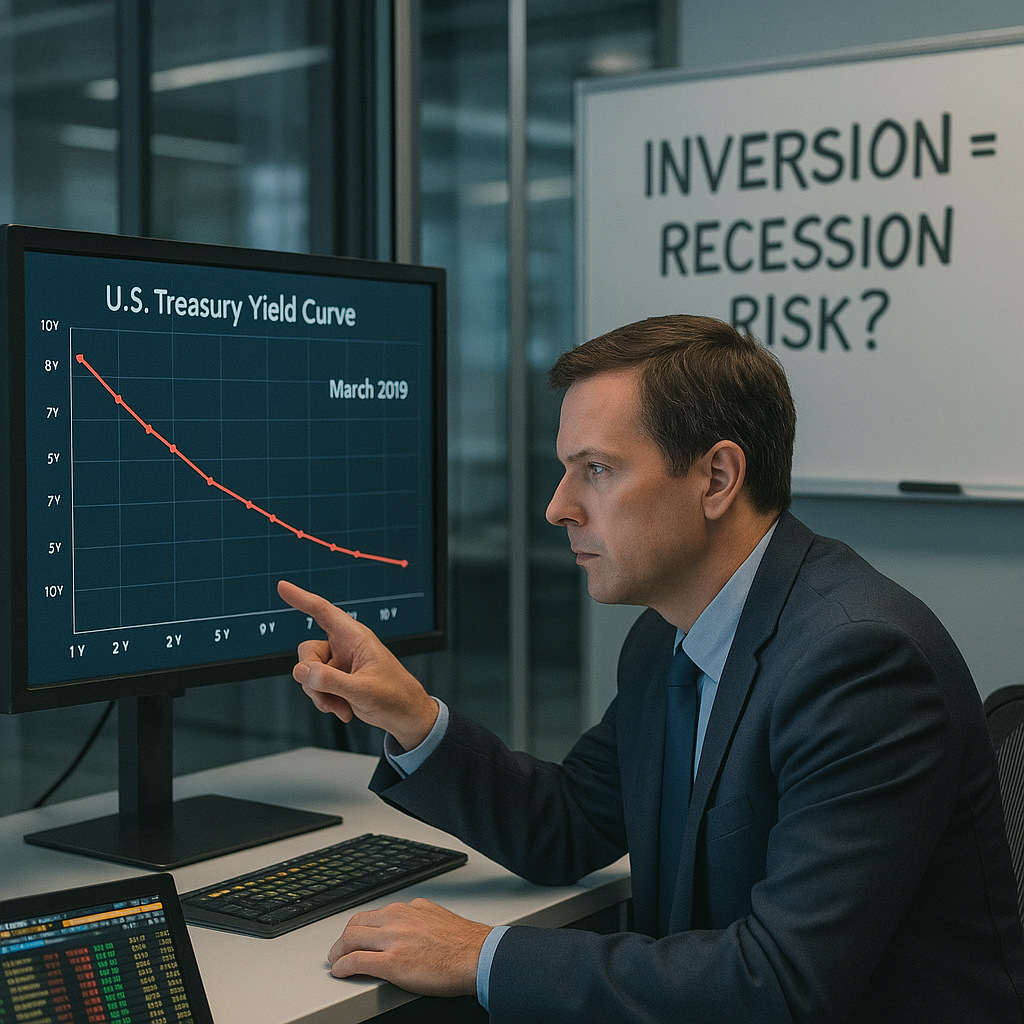
On March 15, the spread between the 10-year Treasury yield and the 3-month Treasury yield turned negative — briefly but significantly. This marked the first major inversion since 2007, just before the global financial crisis.
-
10-year yield: Dropped to around 2.44%
-
3-month yield: Rose to around 2.46%
Although the inversion was modest and temporary, it drew immediate attention from economists, traders, and the media.
Why Is This a Big Deal?
Yield curve inversion is widely regarded as a forward-looking indicator of economic health.
Here’s why it matters:
-
Signals Market Expectations
Investors may expect slower growth and lower inflation in the future, which causes long-term yields to drop. -
Tightening Monetary Policy
The Federal Reserve raised interest rates several times between 2015 and 2018. The inversion suggests markets believe the Fed may have gone too far too fast, risking an economic slowdown. -
Credit Conditions May Tighten
Banks typically borrow short and lend long. An inverted curve compresses profit margins, which can lead to tighter credit and reduced lending activity. -
Investor Sentiment Shifts
An inversion can become a self-fulfilling prophecy as businesses delay hiring or investment out of caution, contributing to the slowdown it signals.
Historical Accuracy of the Yield Curve
Since 1960, every U.S. recession has been preceded by a yield curve inversion. On average, a recession follows within 12 to 18 months.
Examples:
-
2007 inversion → 2008 financial crisis
-
2000 inversion → 2001 dot-com bust
-
1989 inversion → 1990 recession
However, not all inversions lead to immediate downturns. There can be considerable lag, and false positives are possible. Still, the historical pattern is compelling enough that investors treat it very seriously.
What’s Driving the Inversion in 2019?
Several macroeconomic forces contributed:
1. Global Economic Uncertainty
Trade tensions between the U.S. and China, Brexit concerns, and signs of slowing growth in Europe and Asia created downward pressure on yields as investors fled to safe-haven assets like Treasuries.
2. Fed Policy Expectations
Markets began pricing in future rate cuts by the Federal Reserve, despite the Fed’s then-official stance of rate hikes. This divergence pressured the long end of the curve.
3. Slowing Domestic Growth
Economic data in Q1 2019 showed slower business investment, weak retail sales, and softening manufacturing indices — pointing toward deceleration.
How Investors Are Reacting
The inversion led to increased volatility in equity markets and renewed interest in defensive sectors and safe assets, including:
-
U.S. Treasury Bonds
-
Gold
-
Utility and consumer staple stocks
-
Real estate investment trusts (REITs)
Conversely, cyclical sectors like financials and industrials saw pullbacks. Some investors began rebalancing portfolios, increasing allocations to less risky assets.
Additionally, yield curve derivatives, like futures and swaps, saw a spike in trading as institutions hedged against potential recession risk.
What the Fed Is Watching
In response to market reactions, the Federal Reserve took a more dovish tone in March 2019, signaling a pause on further rate hikes.
Chairman Jerome Powell acknowledged that global uncertainties and softening data warranted a more cautious approach, though he emphasized that the U.S. economy remained fundamentally healthy — with low unemployment and moderate inflation.
Still, the Fed made clear it was monitoring the yield curve closely as part of its broader outlook.
What Should Investors Do?
An inverted yield curve is a warning, not a guarantee. Here’s how smart investors are approaching the situation:
-
Reassess risk exposure in portfolios, particularly in overvalued or cyclical sectors.
-
Diversify geographically to hedge against regional economic shocks.
-
Focus on quality: companies with strong balance sheets, steady cash flow, and recession-resilient models.
-
Watch for confirmation in other indicators: consumer confidence, unemployment trends, and earnings forecasts.
Some are even using this period to prepare for opportunity — building liquidity for future buying if a downturn occurs.
Conclusion
The yield curve inversion of March 2019 is a flashing yellow light for investors and policymakers. While it doesn’t guarantee a recession, it’s a clear signal that the bond market is anticipating economic slowdown — and perhaps a shift in monetary policy.
Whether or not a recession materializes in 2020 or beyond, the inversion serves as a reminder of the delicate balance between interest rates, market sentiment, and real economic activity.
In times like these, informed, diversified, and disciplined investment strategies are more important than ever.